STEM in the garden: how to monitor plants with IoT sensors and Grafana Cloud
This post was originally published on the Grafana blog which you can view here.
As a Senior Developer Advocate here at Grafana Labs, I’m always looking for opportunities to introduce tech concepts to my 8-year-old daughter in a fun and relatable way. She’s been into gardening since last year, so during a recent STEM week, I decided to use gardening as a way to introduce her to the concepts of IoT, monitoring, and observability.
In this blog post, I’ll walk through how my daughter and I recently set up an IoT project to monitor the moisture levels of our plants using Arduino, Prometheus and Grafana Cloud — and also recap all the fun we had along the way.
Green thumb or not, you can read on to set up this project at home. You can also check out our GitHub project, plant-monitoring, to find all the code in this post.
Understanding IoT through gardening
Since the start of COVID-19, we’ve bought a few indoor plants. Some have flourished, while others failed to survive. It seemed we either watered the plants too much or didn’t water them enough.
To start explaining IoT to my daughter, I asked her to imagine if each plant had a little green-thumb helper (aka, a sensor) in its soil that could detect moisture levels and inform us when it needed water. Sounds cool, right? I explained that IoT is just that — a way to connect objects, including sensors, to the internet so they can monitor, communicate, and, in some cases, even take action automatically to make our lives easier.
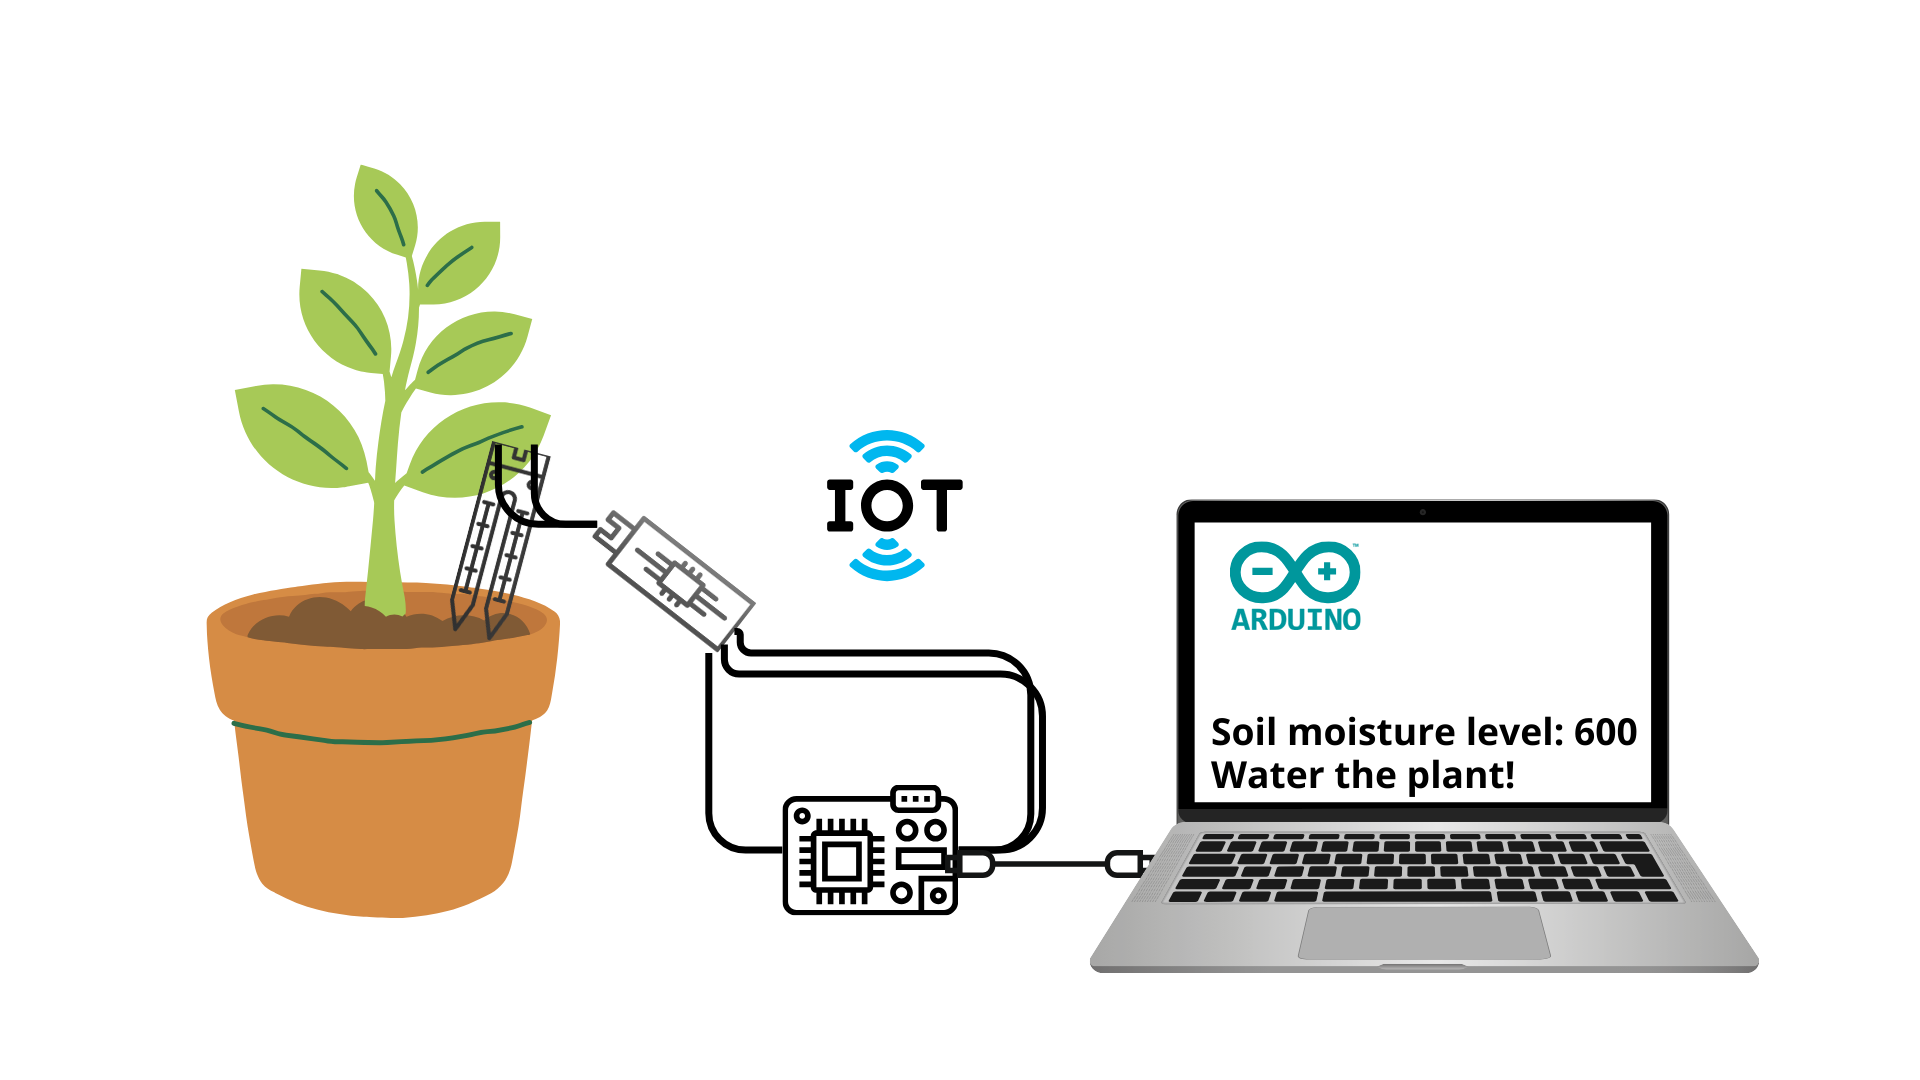
We observed that our soil moisture sensor has two metal parts, similar to a fork. When the soil is wet, water helps electricity flow easily between the metal parts, and when the soil is dry, electricity can’t flow as well.
The moisture sensor passes this information as electrical signals to a development board like an Arduino or ESP32, which acts as the brain of this project.
Once the sensor is connected to a development board, it can have two possible outputs:
- Analog Output (AO), where output is of a variable number depending on the moisture level. When it’s a high number, the soil is dry. When it’s a low number, the soil is wet.
- Digital Output (DO), where output is HIGH when the soil is wet and LOW when the soil is dry.
Project setup
Next, it was time to start setting up our IoT project. I used this avocado monitoring project from Grafana Labs Senior Software Engineer Ivana Huckova for inspiration (along with lots of Googling). I also watched a GrafanaCON 2021 session, Easy DIY IoT Projects with Grafana, by Ivana and Grafana Labs Principal Software Engineer Ed Welch, to see other cool ways to monitor IoT setups with Grafana.
Then, there were a few bits of hardware I had to purchase for the project:
- Soil moisture sensor
- ESP32 S3 DevKitC Development Board to process the output received from the sensor
- Dupont cables to connect the sensor to the board
- Breadboard to plug the components
- USB-C cable to connect the board to my laptop
For the software, I also had to install Arduino IDE, which is open source software you use to write, edit, and upload code to a development board.
Connecting all the hardware
Now that we had everything we needed, it was time to piece together all the hardware and get to the most exciting part of the project.
Our first step was to connect the soil moisture sensor pieces using the Dupont cables. Afterward, we attached the ESP32 development board to the breadboard. While this is an optional step, we found that, in our case, inserting the development board into the breadboard made it more stable.
Next, we connected the moisture sensor to the development board by connecting the following pins:
- VCC pin to 3.3V pin
- GND pin to GND pin
- AO to pin 11
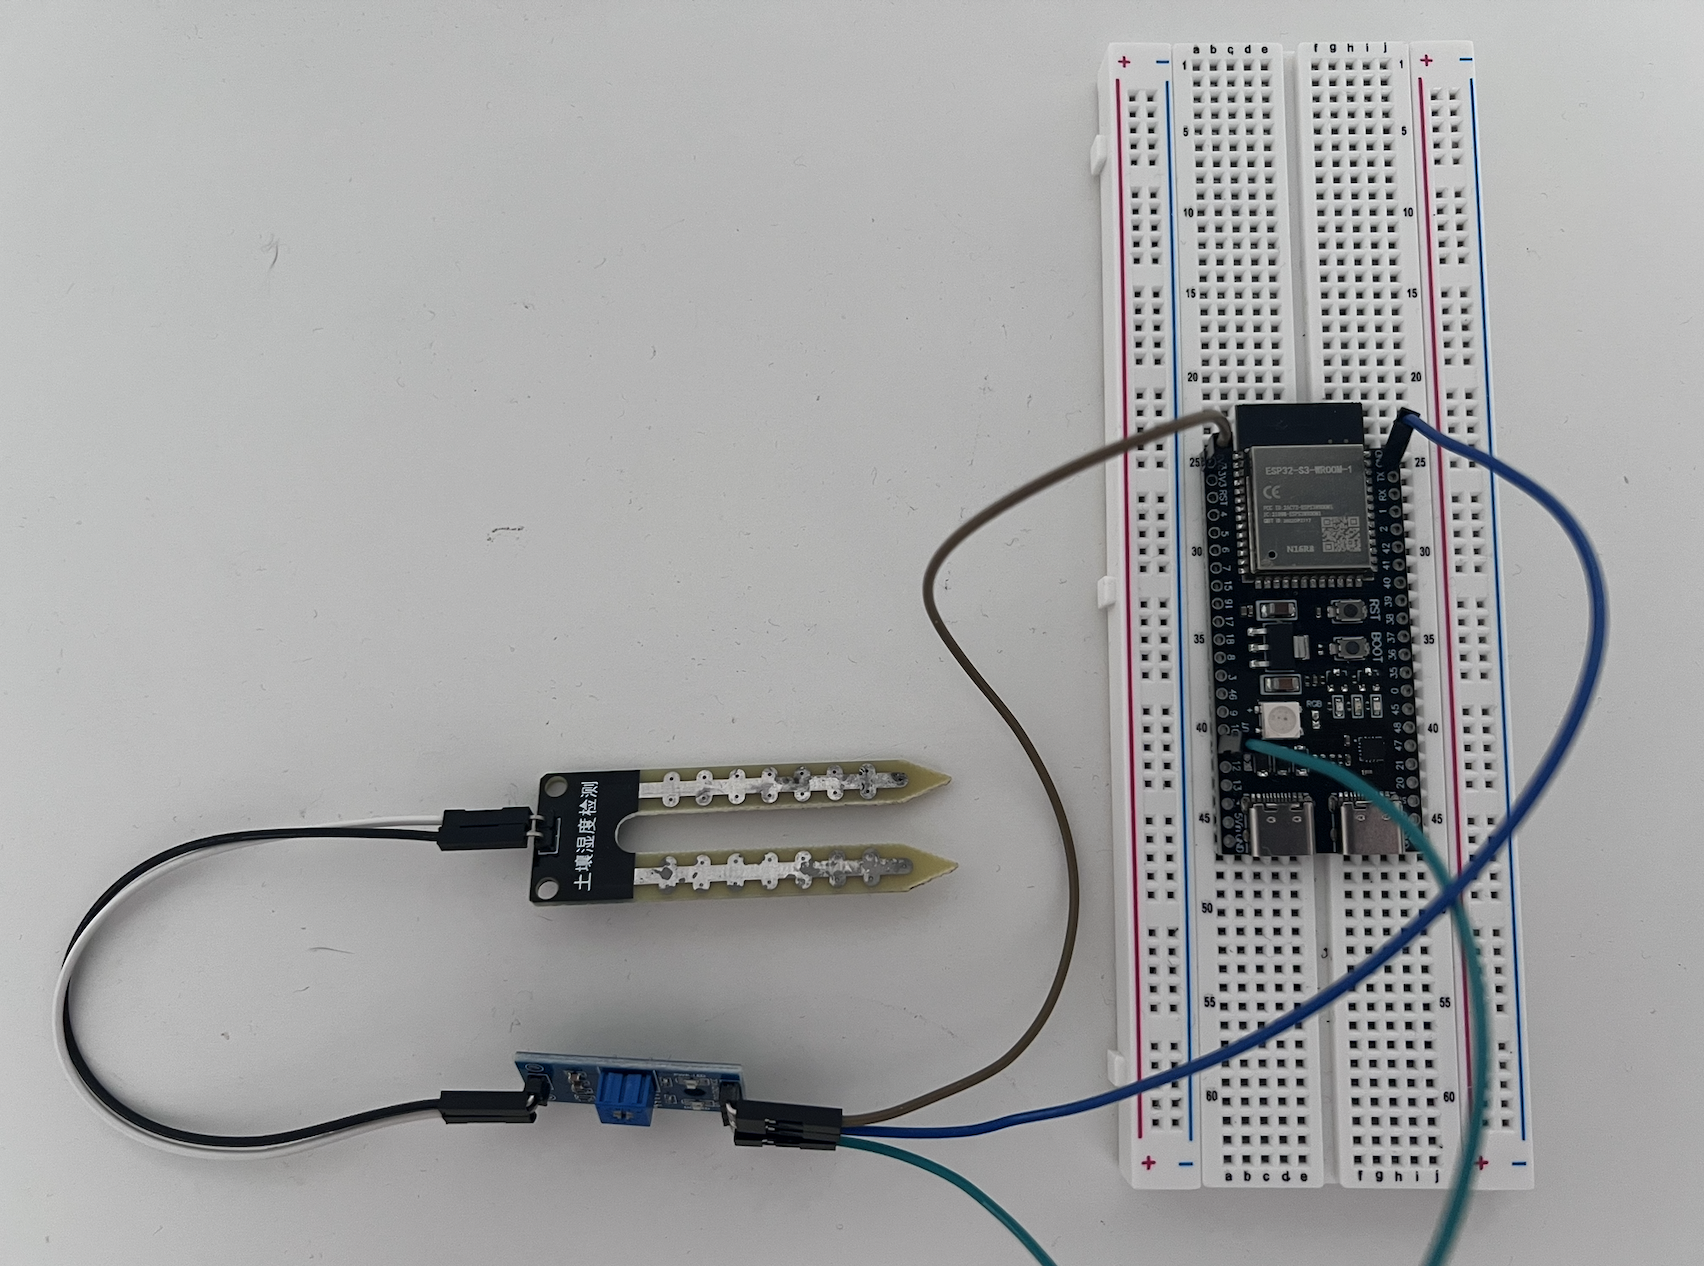
We also inserted the moisture sensor directly into the soil of a plant that had recently been watered.
Creating the initial program
Once the hardware bits were done, I connected the development board to my laptop via a USB-C cable. Next, I followed the instructions on the GitHub repo IoT with Arduino and Grafana to set up the Arduino IDE on my laptop, including adding support for our ESP32 board. (Note: Ivana also explains this process in a previous blog post.)
For our first iteration, I wanted to keep things as simple as possible so my daughter could easily follow along.
In Arduino IDE, we created a new file called plant-monitoring.ino and added the following lines of code:
// Define the sensor pin and sensor variable
int sensorPin = 11;
int sensorValue = 0;
void setup() {
  // Initialize serial communication at 9600 baud rate
  Serial.begin(9600);
}
void loop() {
  // Read the analog value from the sensor
  sensorValue = analogRead(sensorPin);

  // Check if the soil is dry
  if (sensorValue > 500) {
    Serial.print(sensorValue);
    Serial.println(" - Status: Soil is too dry - time to water!");

  } else {
    Serial.print(sensorValue);
    Serial.println(" - Status: Soil is perfect!");
  }

  // Wait 5s before taking another reading
  delay(5000);
}
Essentially, the code snippet above defines our sensor pin. Within the setup function, we initialize the serial communication at a 9600 baud rate. Within the loop function, we continuously read the analog value provided by the sensor. If the sensor value is above 500, the soil is dry. Otherwise, if the value is low, the soil is wet.
Note: To test our project easily, we waited 5 seconds before taking another moisture reading. You can increase this value so you wait for a longer amount of time to avoid quickly corroding the moisture sensor.
To explain the baud rate to my daughter, I used the following analogy: “Imagine you are talking with your best friend, and you both agree to speak 9600 letters every second. If you speak less or more than 9600 letters, your communication might not be as clear.”
Running the program
After uploading the code to the development board and opening up the serial monitor in Arduino IDE, we saw the following messages:
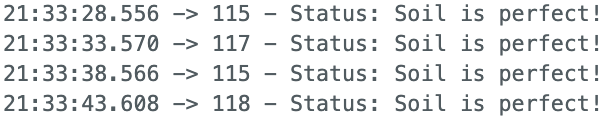
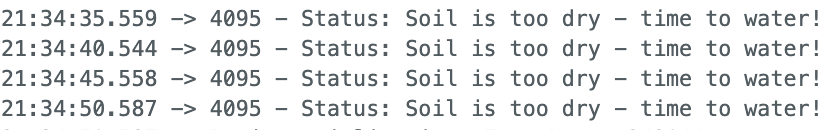
Seeing these logs was a good sign after inserting the moisture sensor into our plant’s soil. After taking the sensor out, we saw the following messages:
What’s observability, Mom?
After completing the project setup, the next step was to explain the concepts of monitoring and observability to my daughter — and this, of course, is where Prometheus and Grafana came in.
I explained that monitoring is a way to check the plant’s health. We monitor the moisture level of the soil, and if it’s too dry, we get an alert to water it. We are reacting to the situation, and to the plant’s needs.
On the other hand, observability takes monitoring to another level. Observability is a way to understand why our plant’s health changes over time. It’s about looking at all our data, identifying patterns over time, and predicting what will happen next. For example, does the plant’s soil moisture drop during a specific time of day? Do we need to include other factors, such as room temperature and humidity, into our project to support our predictions? Observability considers all these points and more, so we can optimize the living conditions of our plants.
I then introduced my daughter to Prometheus and Grafana as the de-facto platforms for monitoring and observability.
Prometheus: The Gardener
To introduce Prometheus, I asked her to imagine an imaginary gardener who collects sensor values and stores all of them in a toolbox. I also told her that, in order to get these values from Prometheus, we must speak its language: PromQL.
soil_moisture{monitoring_type="gabby_plant"}
Prometheus will return the soil moisture sensor values with timestamps so we know when the values are collected. Here’s an example:
| Time | Sensor value |
|---|---|
| 2025-03-17 19:30:00 | 180 |
| 2025-03-17 20:00:00 | 200 |
| 2025-03-17 20:30:00 | 260 |
Setting up Grafana Cloud
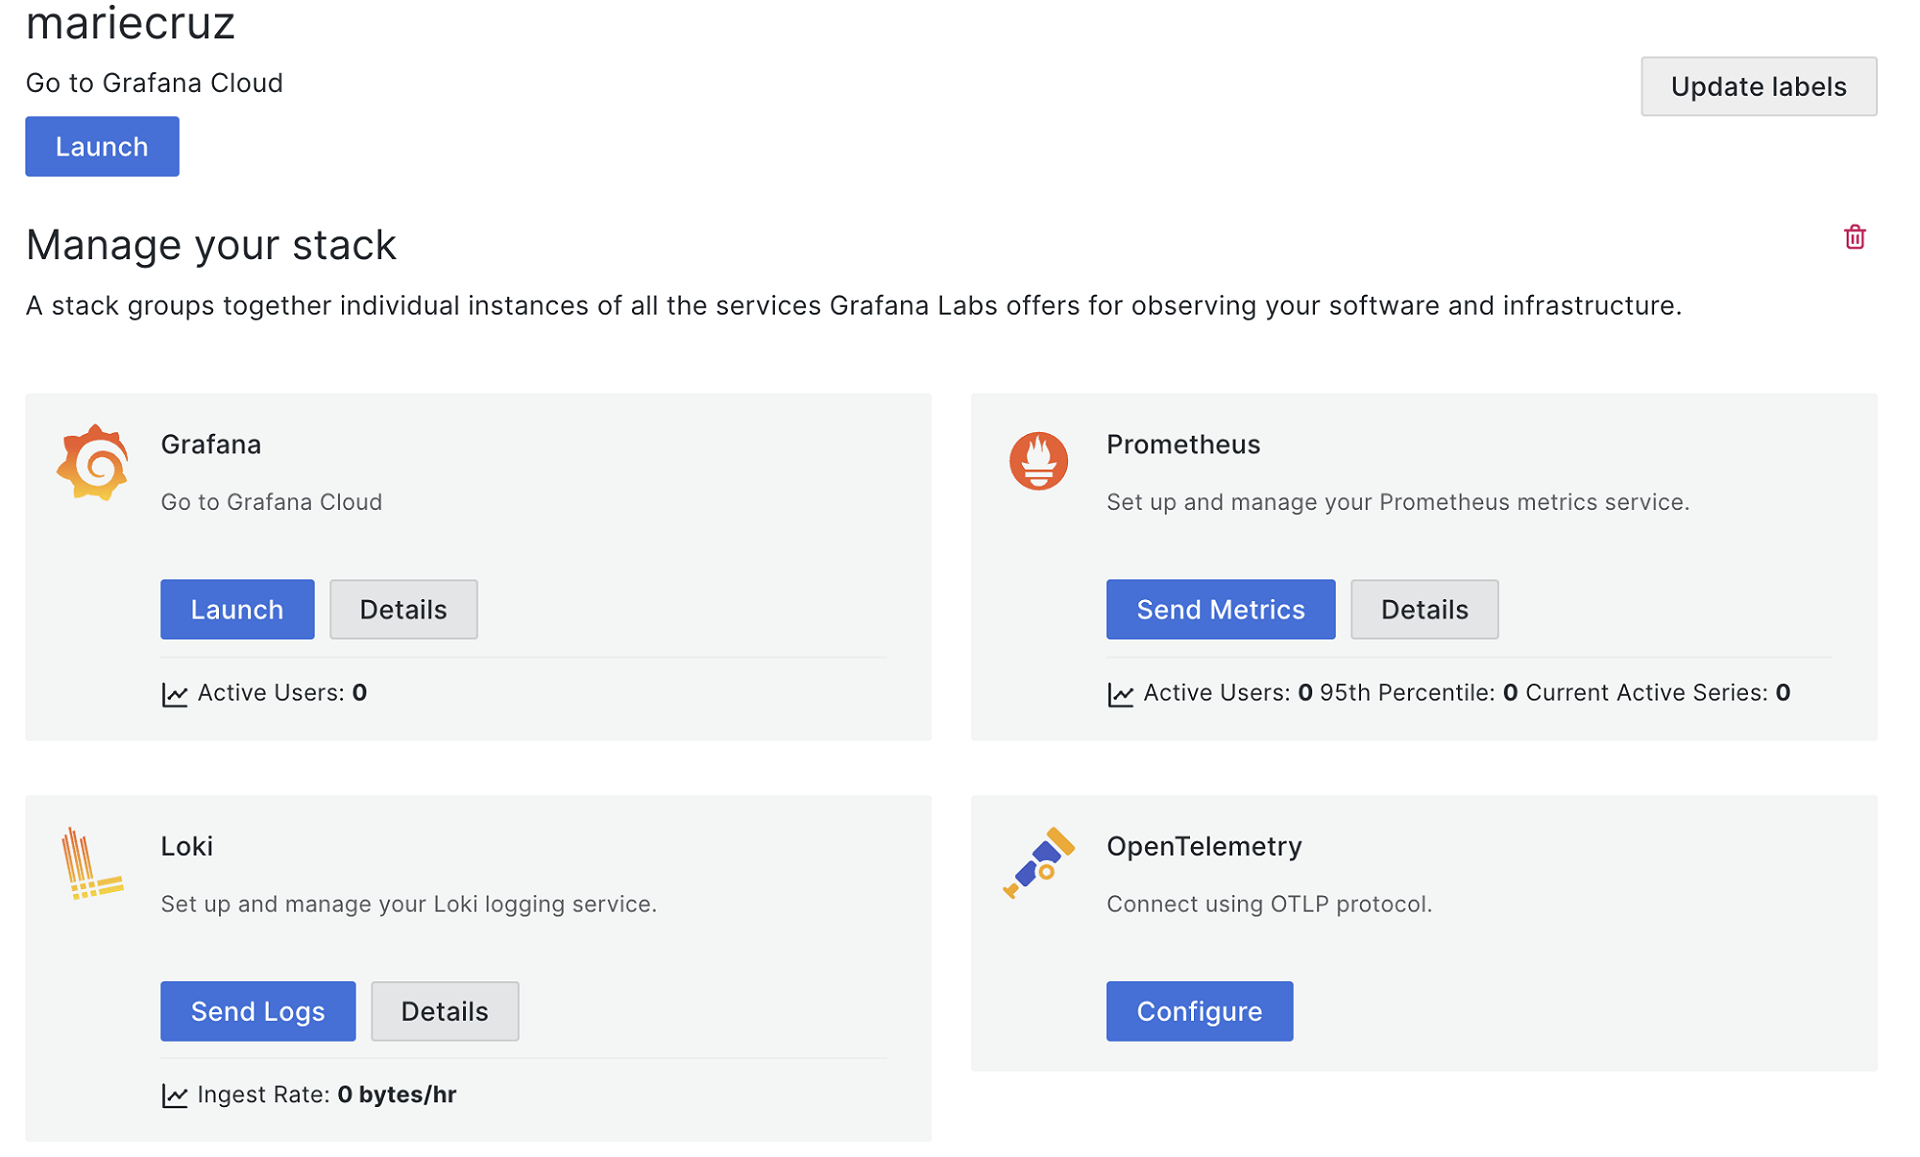
The easiest way for me to show Prometheus was to set up a Grafana Cloud account using the free tier, which comes with a fully managed Prometheus instance. After signing up, we were redirected to a landing page like the one shown below.
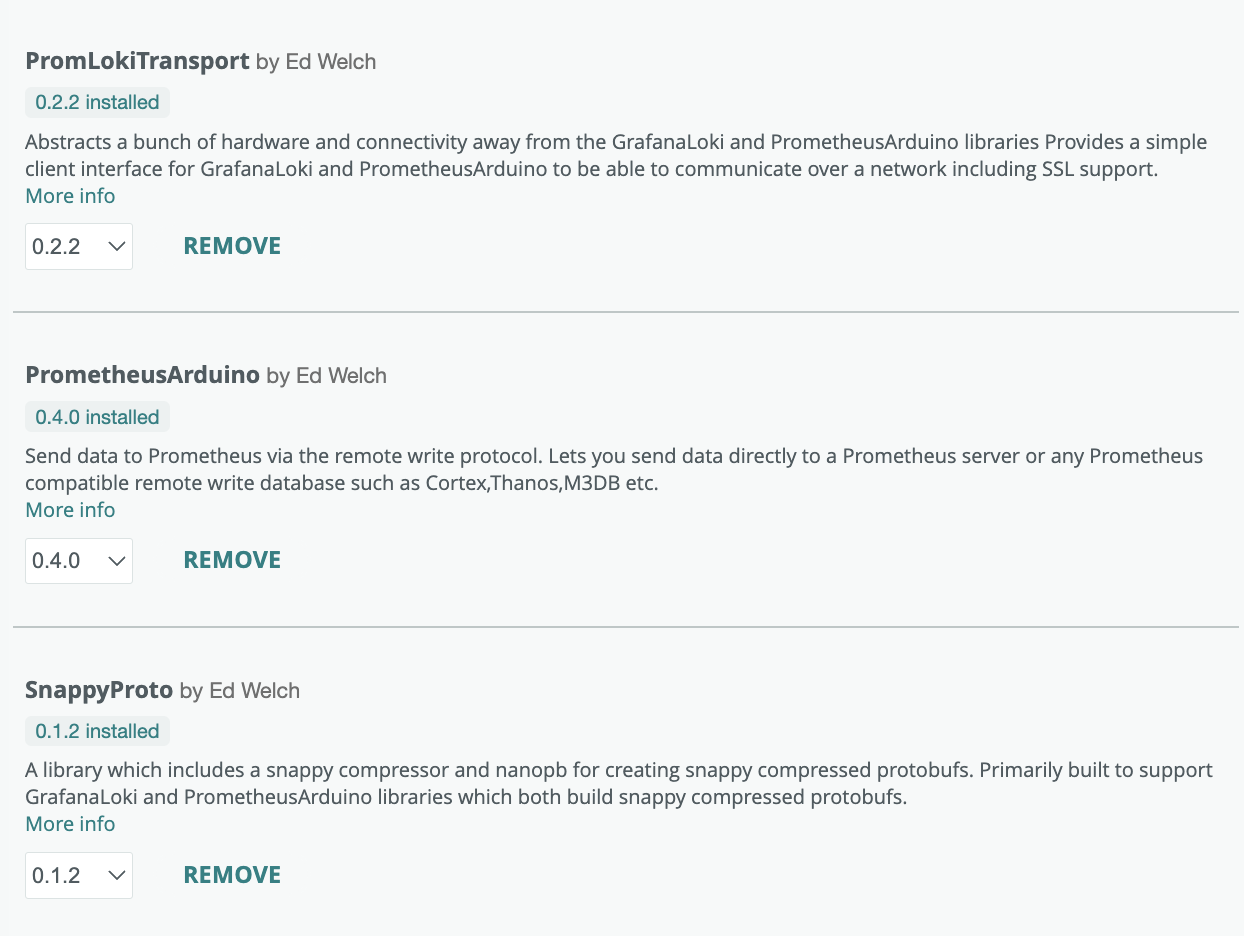
Installing Prometheus libraries in Arduino
To make it easier for our Arduino code to connect to Prometheus, we installed additional libraries (shown below), as instructed in the IoT with Arduino and Grafana GitHub repo, which was relatively straightforward.
Setting up Prometheus
The next step was to store the details of our Prometheus instance in a configuration file so that the code we wrote in Arduino could connect to Prometheus.
To do this, we followed all the steps listed in the Sending metrics section of the IoT with Arduino and Grafana GitHub project. We ended up with a new file called config.h, which contained the following (some values omitted for security):
// Prometheus details
#define GC_PROM_URL "prometheus-prod-13-prod-us-east-0.grafana.net"
#define GC_PROM_USER "" // username
#define GC_PROM_PASS "" // token
#define GC_PROM_PATH "/api/prom/push"

#define GC_PORT 443

// Wifi details
#define WIFI_SSID     "" // WIFI name
#define WIFI_PASSWORD "" // WIFI password
We also created another file called certificates.h, which included a certificate we could use to connect to Grafana Cloud securely. The certificate content was copied from the certificate file of the prometheus-arduino GitHub project.
These two files were eventually included in our plant-monitoring.ino file (more on that below).
Updating our initial program
The prometheus-arduino GitHub project also has a code example of how to send the metrics from Arduino to Prometheus. Instead of reinventing the wheel, we copied the code example and updated it slightly to work with our code. I remember my daughter asking if this was cheating, to which I replied, “This is quite normal with programming. 😅”
The final program can be seen here.
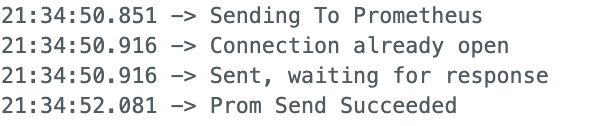
After uploading the updated program to our development board, we saw the following logs on our serial monitor. 🙌🏻
Grafana Cloud: The Visualizer
The final piece of the project was to visualize all our data with Grafana Cloud. While Prometheus was our gardener, I explained that Grafana is our cool visualizer. It takes the sensor values from Prometheus and turns them into beautiful graphs, making those values easier to understand.
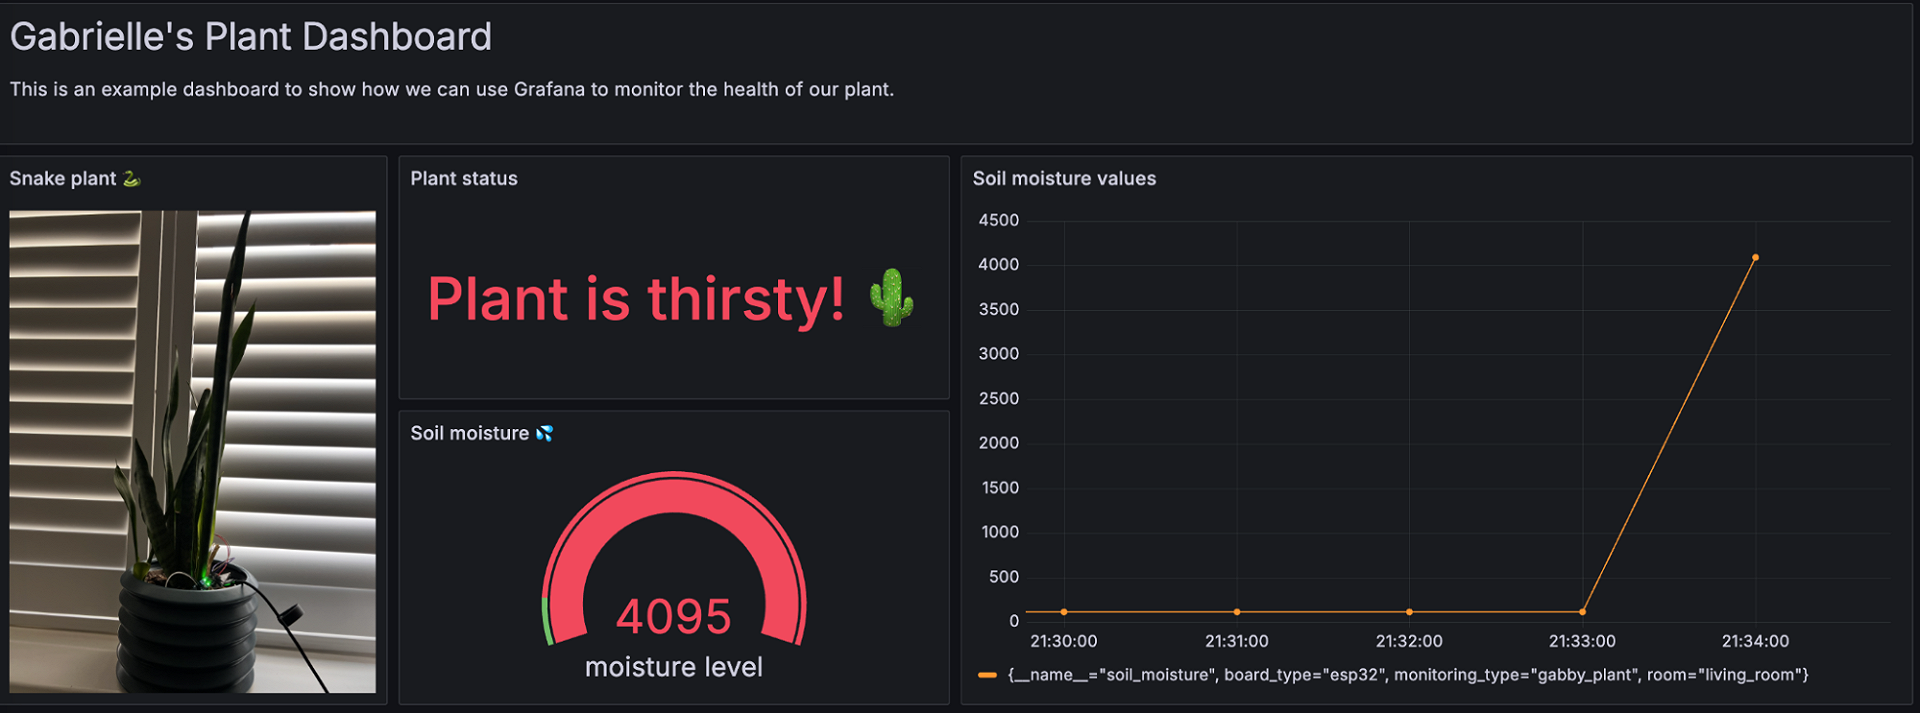
The Plant Dashboard
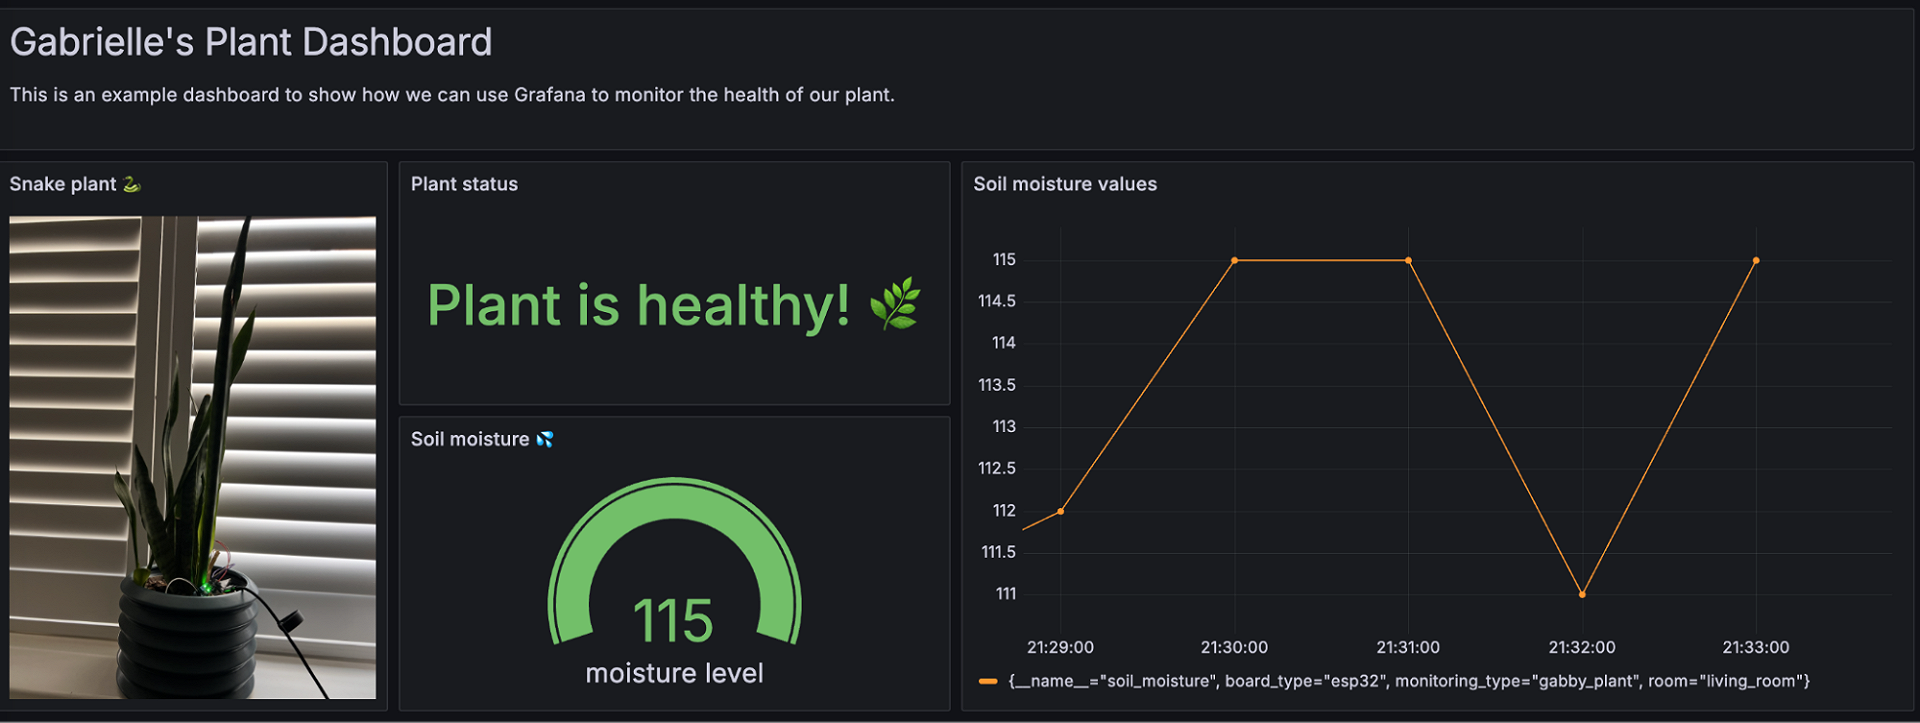
We created our dashboard using different visualization types, such as the classic time series, stat, gauge, and text panels. Since Prometheus is the default data source for Grafana Cloud, we just had to select the correct metric and label values when creating the different panels.
We ended up with the following dashboard by configuring value mappings to print different texts based on the values. 🙌🏻
Thirsty Plant Alert
Having a dashboard to look at is excellent, but we thought getting an alert when our plant was thirsty would be even better. So, the final piece of our project was to configure Grafana Alerting.
To set this up, we created a new alert rule with the alert condition “when the query is above 500” to ensure we would only be alerted if the soil moisture value was above 500.
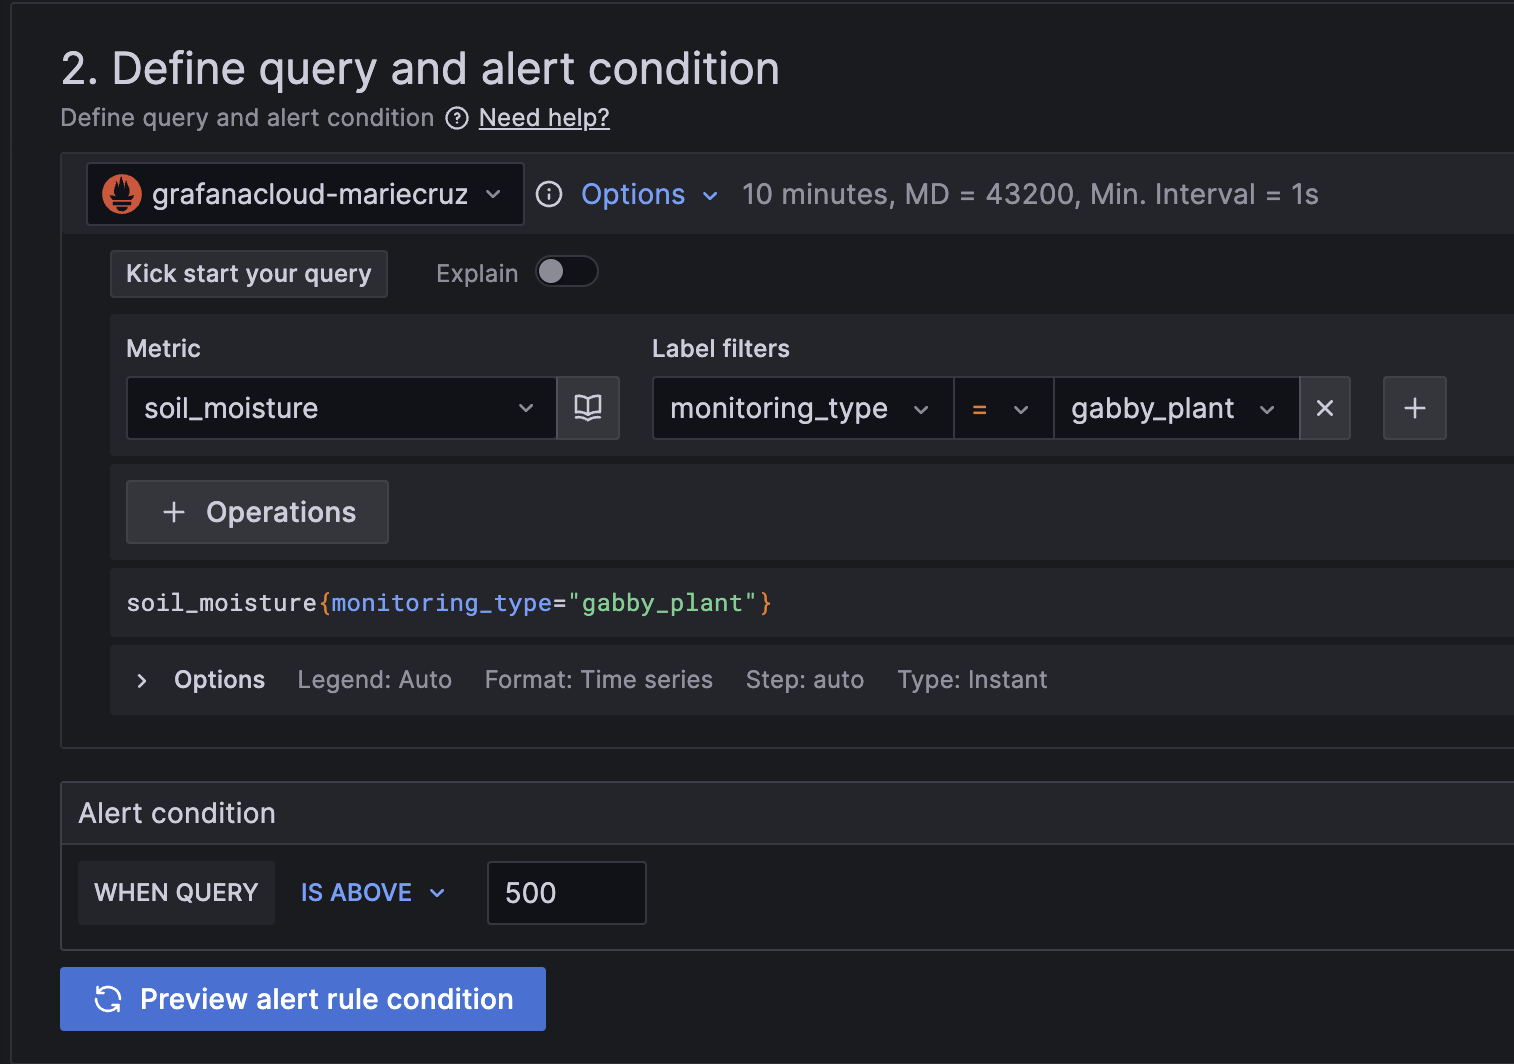
We also linked the alert to our dashboard and time series panel for an additional visual indicator of whether an alert was firing or not. Note: you can learn more about this process in this video.
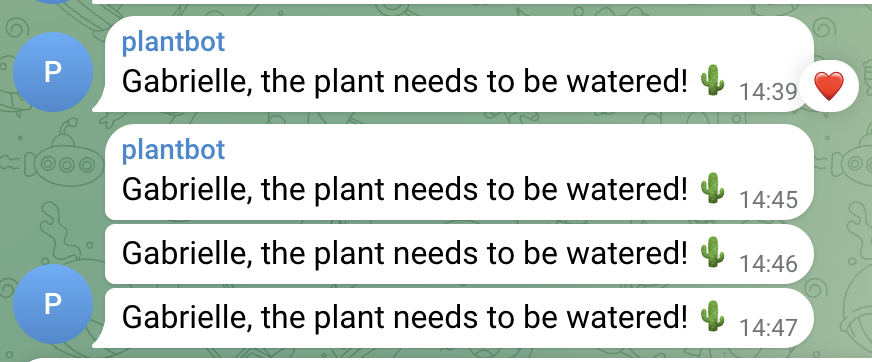
Finally, we created a new contact point to define where our alerts should be sent when an alert rule is triggered. We chose Telegram and followed the instructions to configure Telegram for alerting. So, every time the sensor values go above 500, we get the following notification on Telegram:
Wrapping up
Overall, the soil moisture sensor project was a great starter kit for my daughter to learn more about IoT and Grafana. She was ecstatic to see everything working from start to finish and even presented the project to her classmates, who were all impressed.
By introducing her to new technical concepts, she also learned more about my work and what I do as a Developer Advocate here at Grafana Labs.
Happy planting!